
Creating an ESP32 Firebase Dashboard allows you to visualize temperature and humidity data from a DHT11 sensor using Firebase and Google Charts. This project is ideal for remote environmental monitoring, IoT applications, and real-time data visualization from any location.
In this guide, you’ll connect your ESP32 to Firebase Realtime Database, send sensor readings, and build a responsive web dashboard that displays the data using gauges.
What You Will Need
Hardware:
- ESP32 board
- DHT11 temperature and humidity sensor
- 10kΩ resistor (optional)
- Jumper wires
- Breadboard
Software:
- Arduino IDE
- Firebase Realtime Database
- Firebase ESP Client Library
- Google Charts for visualization
Step 1: Set Up Firebase Realtime Database
- Go to https://console.firebase.google.com/
- Create a new project
- Enable Realtime Database from the “Build” menu
- Choose “Start in test mode”
- Go to Project Settings → Service Accounts → Database Secrets
- Copy your Database URL and Secret Key
If you’re unsure how to complete the Firebase setup, refer to this full guide:
👉 Complete Firebase Setup for ESP32
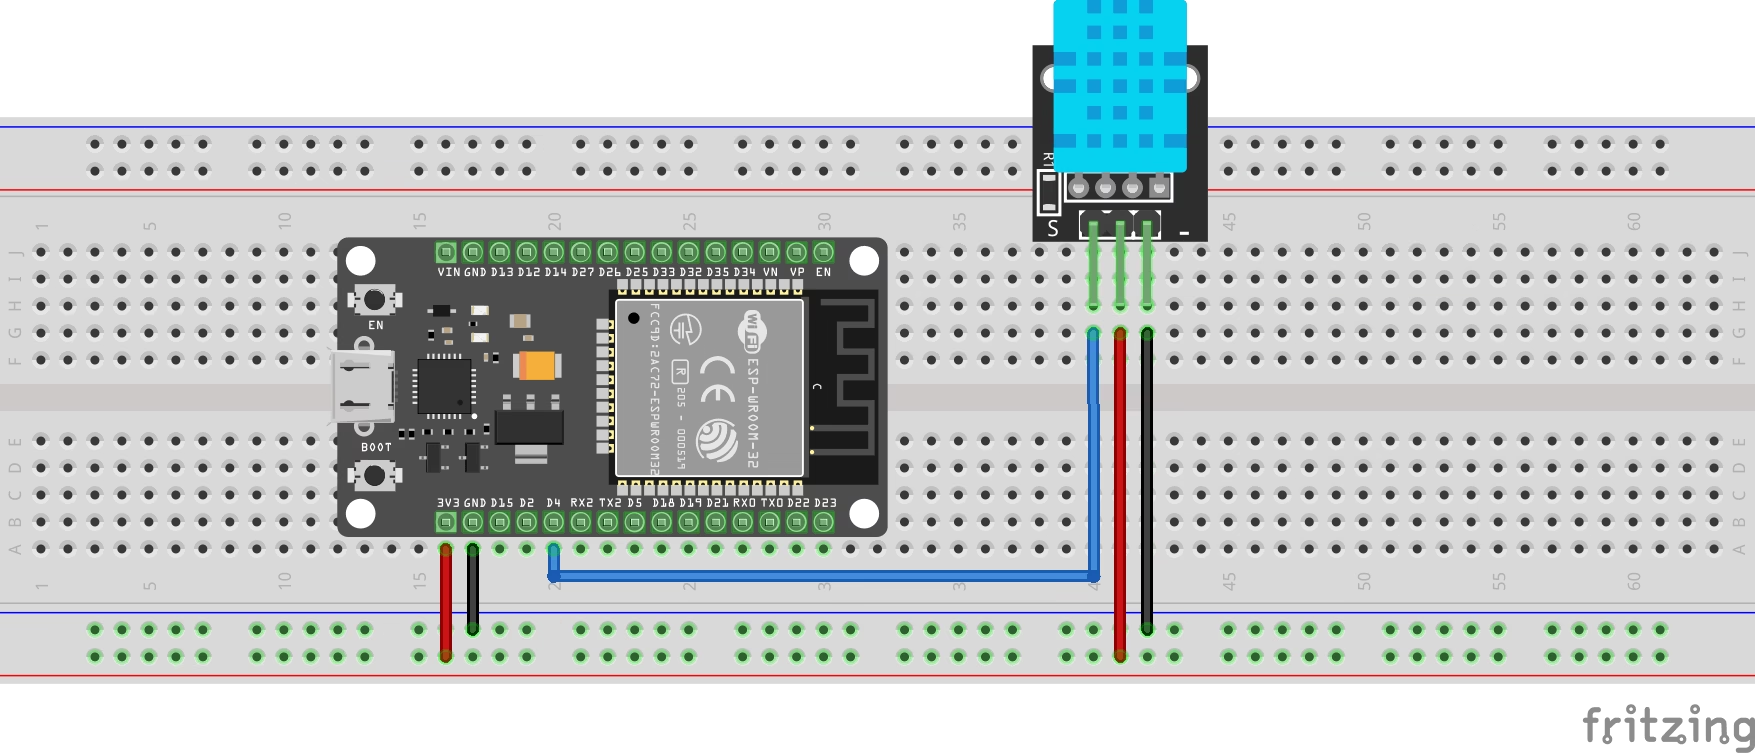
Step 2: Connect DHT11 to ESP32
- DHT11
VCC→ ESP323.3V - DHT11
GND→ ESP32GND - DHT11
DATA→ ESP32GPIO 4
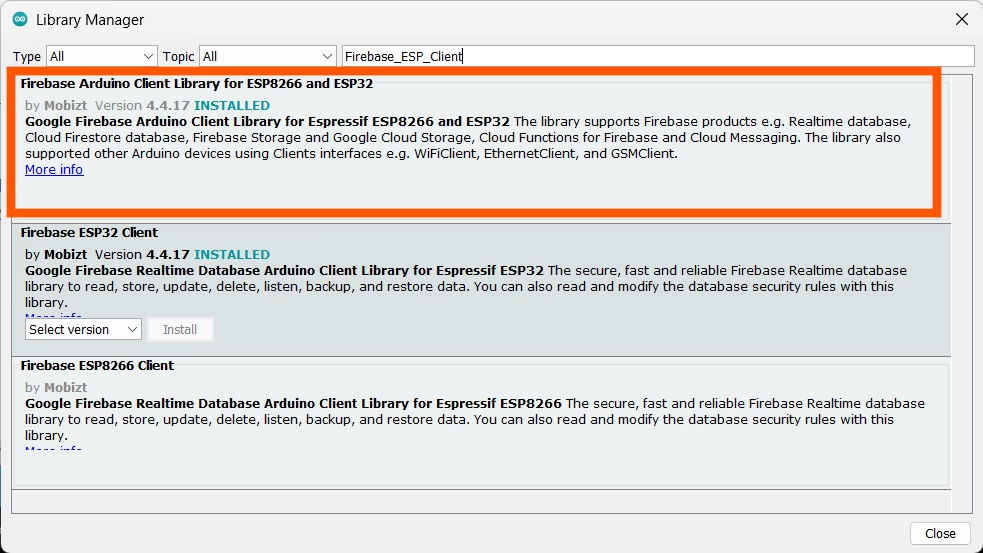
Step 3: Install Required Libraries in Arduino IDE
Install these libraries via Library Manager:
- DHT sensor library by Adafruit

- Firebase ESP Client by Mobizt
Here’s complete guide how to interface DHT11 with ESP32.
Step 4: ESP32 Code to Send Data to Firebase
//ESP32 Firebase Dashboard
#include <WiFi.h>
#include <Firebase_ESP_Client.h>
#include "DHT.h"
#define WIFI_SSID "Your_SSID"
#define WIFI_PASSWORD "Your_PASSWORD"
#define DATABASE_URL "https://your-project-id.firebaseio.com/"
#define DATABASE_SECRET "your_firebase_secret"
#define DHTPIN 4
#define DHTTYPE DHT11
DHT dht(DHTPIN, DHTTYPE);
FirebaseData fbdo;
FirebaseAuth auth;
FirebaseConfig config;
unsigned long previousMillis = 0;
void setup() {
Serial.begin(115200);
dht.begin();
WiFi.begin(WIFI_SSID, WIFI_PASSWORD);
while (WiFi.status() != WL_CONNECTED) {
delay(500);
Serial.print(".");
}
Serial.println("WiFi connected");
config.database_url = DATABASE_URL;
config.signer.tokens.legacy_token = DATABASE_SECRET;
Firebase.begin(&config, &auth);
Firebase.reconnectNetwork(true);
}
void loop() {
if (millis() - previousMillis >= 5000) {
previousMillis = millis();
float temp = dht.readTemperature();
float hum = dht.readHumidity();
if (!isnan(temp) && !isnan(hum)) {
Firebase.RTDB.setFloat(&fbdo, "/sensor/temperature", temp);
Firebase.RTDB.setFloat(&fbdo, "/sensor/humidity", hum);
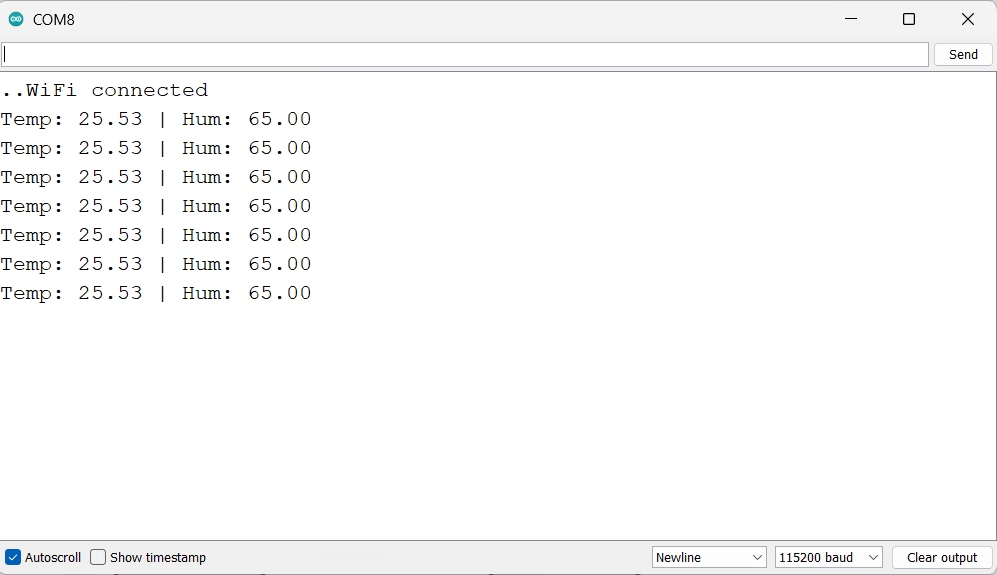
Serial.printf("Temp: %.2f | Hum: %.2f\n", temp, hum);
}
}
}
Step 5: Build a Web Dashboard using Google Charts
Create a simple HTML file (dashboard.html) and paste this code:
<!DOCTYPE html>
<html>
<head>
  <title>ESP32 Firebase Dashboard</title>
  <script src="https://www.gstatic.com/charts/loader.js"></script>
  <script>
    google.charts.load('current', {packages: ['gauge']});
    google.charts.setOnLoadCallback(drawChart);

    var data, chart, options;

    function drawChart() {
      data = google.visualization.arrayToDataTable([
        ['Label', 'Value'],
        ['Temp', 0],
        ['Humidity', 0]
      ]);

      options = {
        width: 400,
        height: 200,
        redFrom: 90,
        redTo: 100,
        yellowFrom: 75,
        yellowTo: 90,
        minorTicks: 5
      };

      chart = new google.visualization.Gauge(document.getElementById('chart_div'));
      chart.draw(data, options);
      fetchData();
    }

    function fetchData() {
      fetch('https://your-project-id.firebaseio.com/sensor.json')
        .then(response => response.json())
        .then(json => {
          data.setValue(0, 1, json.temperature);
          data.setValue(1, 1, json.humidity);
          chart.draw(data, options);
          setTimeout(fetchData, 5000);
        });
    }
  </script>
</head>
<body>
  <h2>ESP32 Firebase Dashboard</h2>
  <div id="chart_div"></div>
</body>
</html>
Replace your-project-id with your actual Firebase project URL.
Result
- The ESP32 sends data every 5 seconds to Firebase.
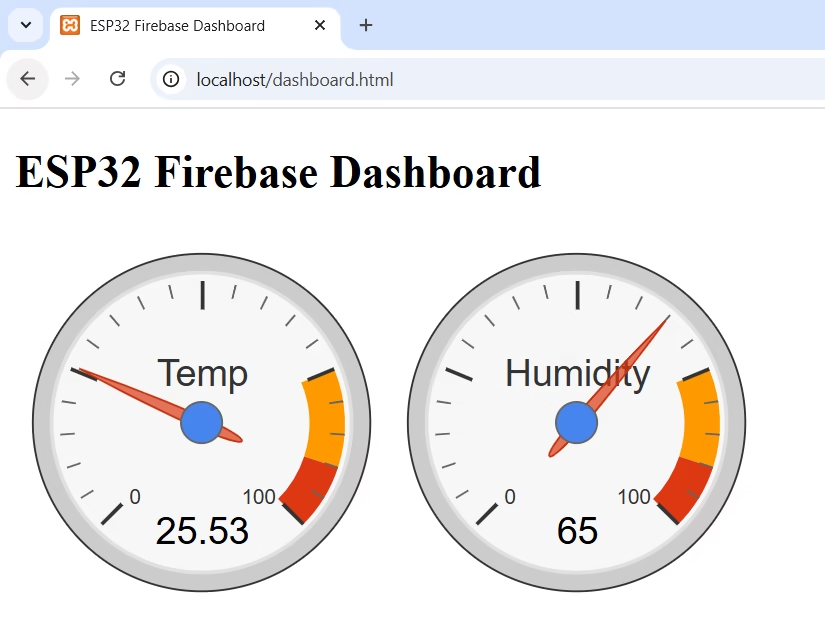
- The HTML dashboard fetches temperature and humidity and displays them using Google gauge charts.
- You can open the dashboard on any device to view real-time updates.
Serial Monitor:
Web Dashboard:
You can save the Dashboard.html file on any server (local or cloud). I have used XAMPP local server to host the dashboard file. There is tutorial available on how to get started on XAMPP and to host the web files in its server.
Small Task: Add a Battery Voltage Monitor
Challenge yourself by connecting a voltage divider to measure your ESP32’s supply voltage (for battery-powered projects). Send the voltage to Firebase under:
/sensor/voltageThen, update your dashboard with a third gauge labeled “Battery” to visualize the voltage level in real time.
This adds a useful feature for power-critical applications like remote weather stations or IoT trackers.
Conclusion
With this ESP32 Firebase Dashboard project, you’ve built a complete remote monitoring system that reads temperature and humidity and visualizes the data in real time. You can expand the dashboard with more gauges, line charts, and controls to match your IoT application.
PREVIOUS FIREBASE AND ESP32 ARTICLES:
Getting Started With Firebase: A Basic Guide – ArduinoYard
ESP32 Firebase Guide: Send Any Sensor Data To Firebase Using Esp32 – ArduinoYard
Firebase To ESP32: Read Realtime Data From Firebase Realtime Database – ArduinoYard